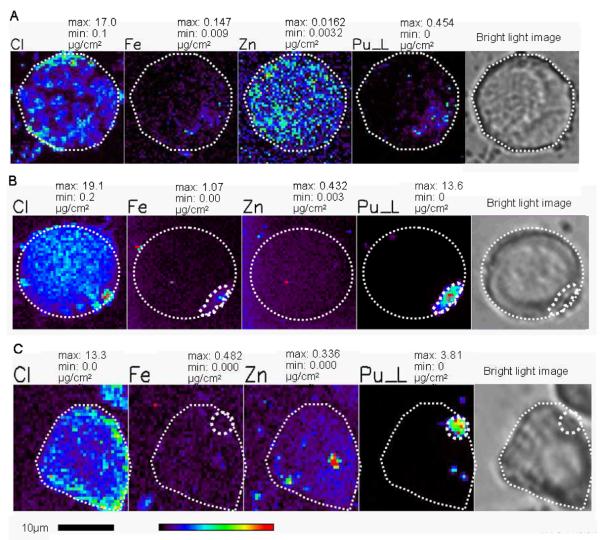
Figure 3.
PC12 cells after treatment with the molecular form of Pu(IV)-citrate (50μM) for three hours (A) and treatment with fresh polymer from 50 μM of 1:1 Pu(IV)-citrate in 1 M perchloric acid and 50 μM iron(III)-citrate (B) or from 50 μM of 1:1 Pu(IV)-citrate in 1 M perchloric acid (C). pH was adjusted before adding serum to the media (for B and C). The Location of plutonium within a cell and corresponding position of highest iron concentrations is denoted by small white circle. The maximum and minimum threshold concentrations in micrograms per square centimeter for a given element are above each image. The rainbow colored scale bar represents the signal intensity; dark pixels represents the low concentration and red pixel represents the highest concentration of corresponding elements. A scale bar is shown below the elemental map.

