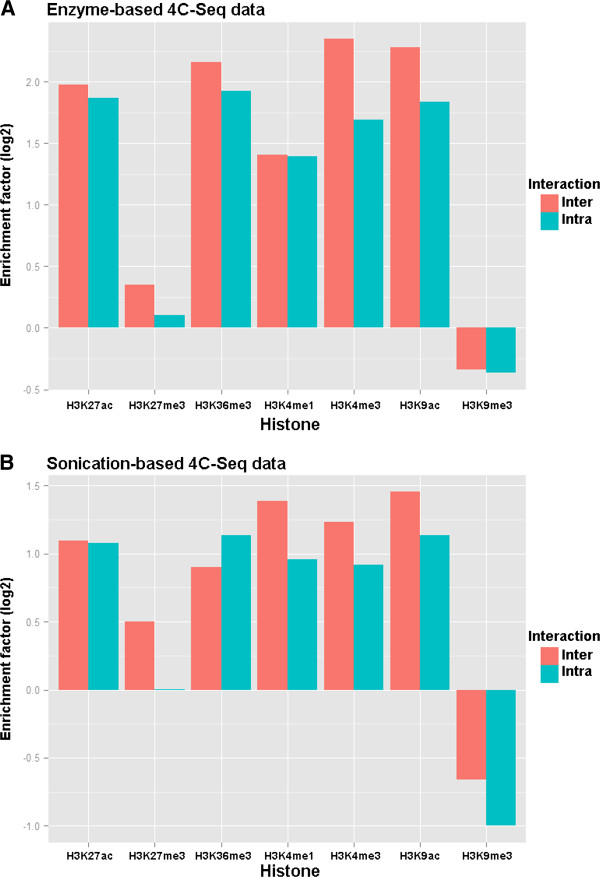
Figure 7.

Enrichment analysis of histone marks. Bar plots of enrichment factor values of different histone marks around the interacting sites within the reproducible interacting regions. Enrichment factor was calculated as the observed sites in proximity to the ChIP-Seq peaks of a particular histone mark divided by the expected sites (random simulated across chromosome 17) close to that mark.
