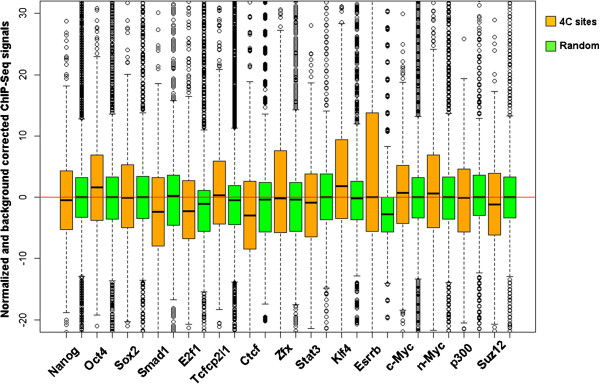
Figure 8.

Enrichment analysis of DNA-binding proteins. Box plots showing distribution of normalized and background subtracted ChIP-Seq tag density of 15 DNA-binding proteins in mouse ES cells. Comparison was made between the 4C interacting sites (brown colored) and random iterated sites (green colored).
