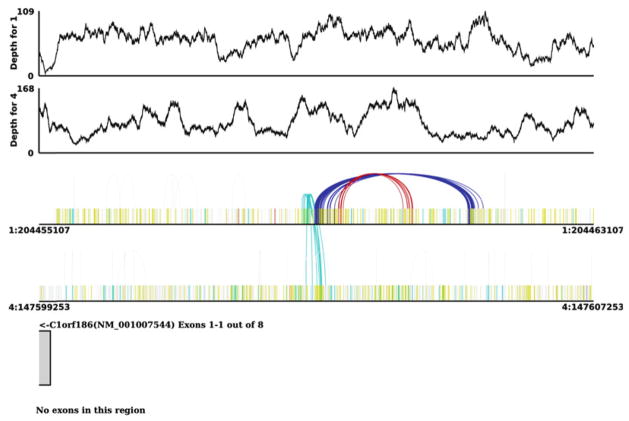
Fig. 3.
Pairoscope graph of predicted inversion and translocation. The top two tracks show the read depth for these regions. The second two show color-coded read pairs indicating the orientation of abnormal read pairs. Single bars in yellow represent reads whose mate did not map. The cyan arcs support a translocation between chromosomes 1 and 4. The red and blue arcs indicate reads oriented in a forward–forward and reverse–reverse orientation, respectively. The gene model shown in the last track indicate this translocation occurs upstream of the translocation start site of an open reading frame.

