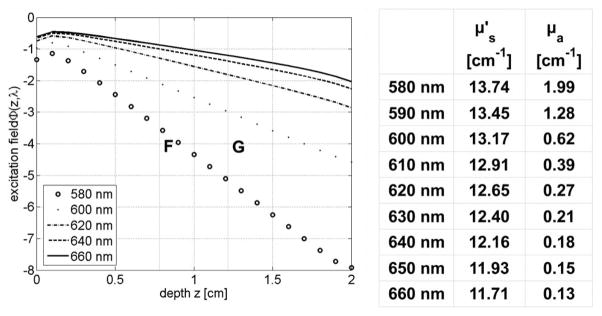
Fig. 2.

Excitation field Φx(r, λ) as a function of λ along the z-axis of a 2-cm-wide tissue slab with excitation source located at z=0. The spectral properties (μa, ) are similar to that of bowel tissue. QDs at locations F and G (see Fig. 3) experience different Φx(r, λl) for light emission.
