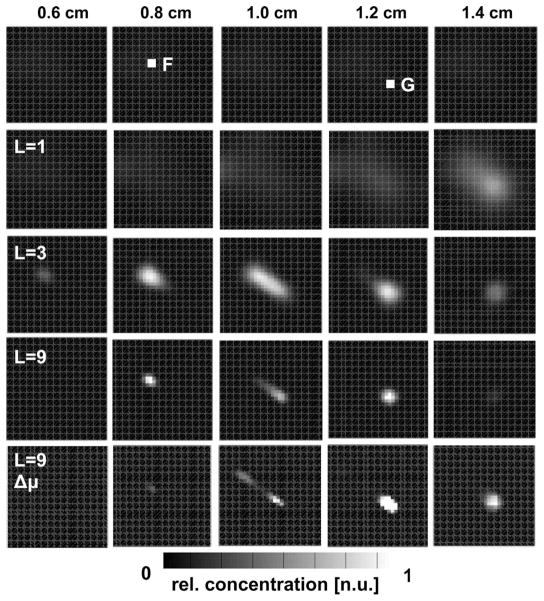
Fig. 5.
Image reconstructions of relative QD concentration for different depths z measured from the top plane of the tissue model. Reconstructions were performed for different sets of λl. L=1, 660 nm; L=3; 660–640 nm; L=9; 660–580 nm. Δμ: μa for image reconstruction was altered by 30% from the original μa.

