
Figure 2.
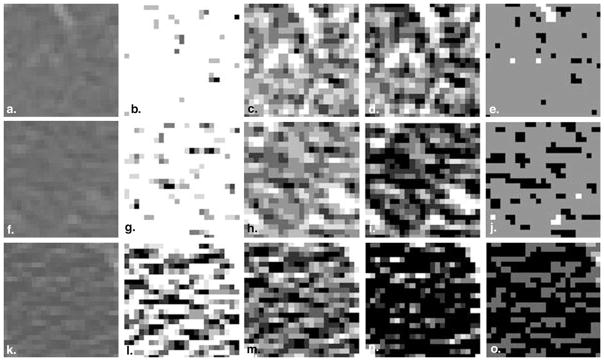
Representative regions of interest from (a) a scan of a normal subject with no emphysema, (f) a scan of a smoker with no emphysema, and (k) a scan of a subject with centrilobular emphysema binned between −1024 and −950 Hounsfield units (HU) (column 2), between −1024 and −856 HU (column 3), between −950 and −856 HU (column 4), and between the minimum and maximum gray levels in the parenchyma (column 5).