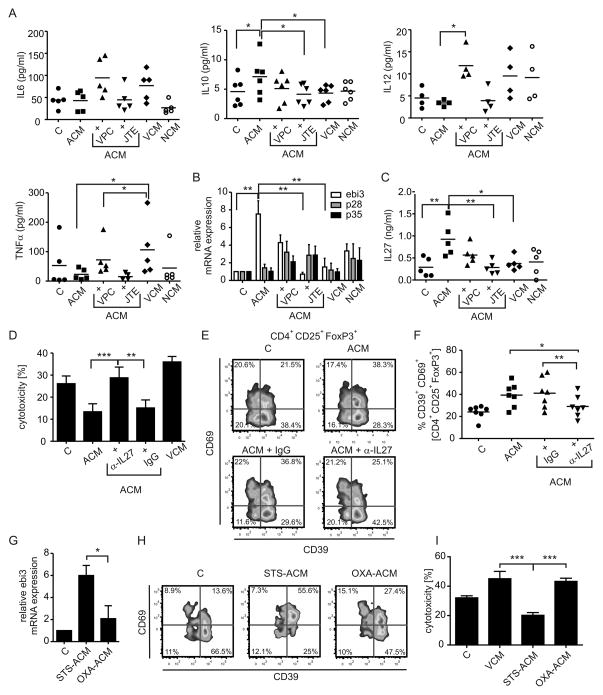
Figure 5.
ACM induces IL-27 in DC in a S1PR4-dependent manner to generate Treg. (A–C) Human monocyte-derived DC were controls or incubated with VCM, NCM or ACM with or without the addition of JTE-013 (15 μM) or VPC23019 (1μM) for 16 h. (A) Secreted cytokines were quantified using Human inflammatory cytokine Cytometric Bead Arrays. Quantification of IL-6, TNF-α, IL-12 and IL-10 in DC supernatants is shown. Individual data points and the mean of five individual donors are shown. (B) Relative mRNA expression of ebi3, p28 and p35 quantitated via qPCR is displayed. Data are means ± SEM from four individual donors. (C) ELISA quantification of IL-27 protein secretion by DC from the individual groups is shown. Individual data points and the mean of five individual donors are shown. (D–F) T cells were co-cultured with control, VCM- or ACM-primed autologous DC with or without the addition of an IL-27-neutralizing antibody (α-IL27) or the isotype control (IgG). (D) Cytotoxicity induced by T cells from individual co-cultures towards living MCF-7 cells. Data are means ± SEM from seven individual donors. (E) Representative FACS traces of CD39 and CD69 expression by Treg from the individual co-cultures. (F) Statistical quantification of CD39+ CD69+ Treg. Individual data points and the mean of seven individual donors are shown, n = 7. (G–I) MCF-7 cells were subjected to 0.5 μg/ml staurosporine (STS) or 30 μM oxaliplatin (OXA) to induce cell death and supernatants were harvested. (G) Expression of ebi3 mRNA in DC treated with STS-ACM or OXA-ACM compared to control DC is displayed. Data are means ± SEM from four individual donors. (H) T cells were co-cultured with control, VCM-, or STS-ACM- or OXA-ACM-primed autologous DC. Representative FACS traces of CD39 and CD69 expression by Treg from the individual co-cultures are shown. (I) Cytotoxicity induced by T cells from individual co-cultures towards living MCF-7 cells. Data are means ± SEM from five individual donors. Asterisks indicate significant differences between groups, * = p < 0.05, ** = p < 0.01, *** = p < 0.001. p-values were calculated using ANOVA with Bonferroni’s correction.

