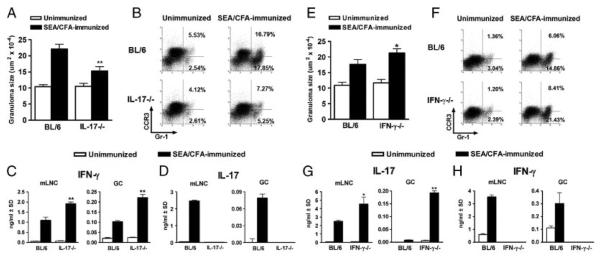
Figure 1.

Immunopathology and cytokine production in infected IL-17−/− and IFN-γ−/− mice. (A and E) Hepatic egg granuloma size at 7 wk of infection (with or without SEA/CFA immunization) comparing BL/6 mice with (A) IL-17−/− or (E) IFN-γ−/− mice was measured by computer-assisted morphometric analysis. Data represent the mean+SEM of 3–5 mice per group from one experiment representative of three. (B and F) GrCs were purified from the livers of BL/6 and (B) IL-17−/− or (F) IFN-γ−/− mice and stained ex vivo to determine the percentage of Gr-1+CCR3+ and Gr-1+CCR3− cells by flow cytometry. Data are from one experiment representative of three, using pooled GrCs from 3 to 5 mice from each group. (C and H) IFN-γ and (D and G) IL-17 levels in 48-h supernatants from SEA-stimulated mLNCs and GrCs were measured by ELISA. Bars represent the mean+SD of triplicate determinations. Data are from one experiment representative of three or four. All statistical analyses are between SEA/CFA-immunized mouse groups and were determined by ANOVA followed by Tukey's multiple comparison test. **p<0.01 and *p<0.05. All gating strategies for flow cytometric analysis are shown in Supporting Information Fig. 1–3.
