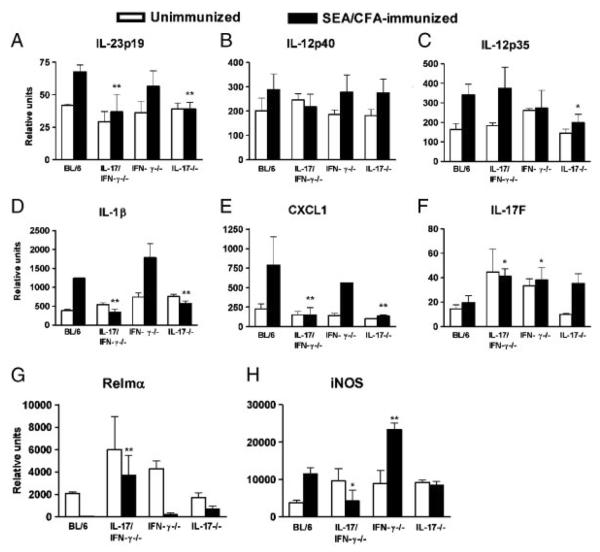
Figure 4.
mLN cytokine expression and liver macrophage marker expression in infected IL-17−/−, IFN-γ−/− and IL-17/IFN-γ−/− mice. Cytokine mRNA expression of (A) IL-23p19, (B) IL-12p40, (C) IL-12p35, (D) IL-1β (E) CXCL1, and (F) IL-17F in mLNs, and macrophage marker mRNA expression of (G) Relmα and (H) iNOS in livers was measured by real time RT-PCR. Data represent mean mRNA levels+SD of 3–5 mice per group. The indicated statistically significant differences in all panels (**p<0.01 and *p<0.05) are between SEA/CFA-immunized cytokine-deficient and BL/6 mice, and were determined by ANOVA followed by Tukey's multiple comparison test. Additional statistically significant differences were as follows: (D and H) IFN-γ−/− versus IL-17−/− or IL-17/IFN-γ−/−, p<0.01, and (G) IFN-γ−/− versus IL-17/IFN-γ−/−, p<0.05.

