Figure 2.

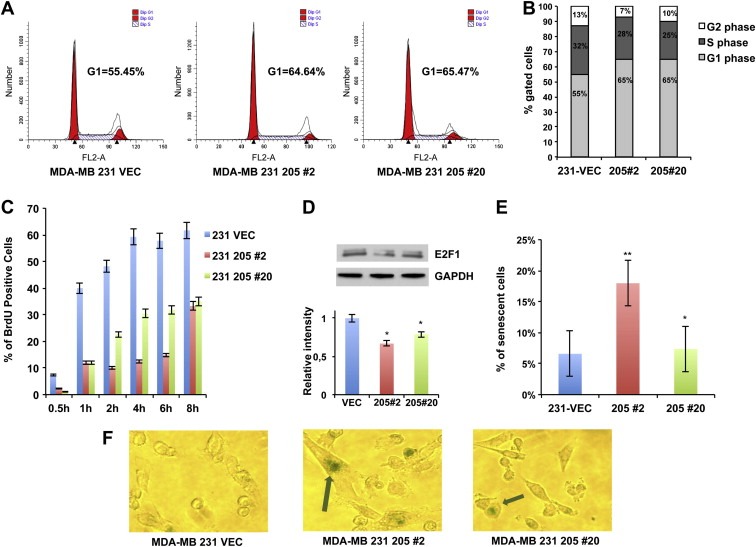
miR‐205 effects on cell cycle progression and cellular senescence. (A) Cell cycle analysis of asynchronously growing miR‐Vec#1, Vec‐miR‐205‐#2 and #20 clones. Cells were harvested after 72 h following the seeding, fixed, stained with propidium iodide and analyzed by flow cytometry. The data obtained were analyzed using ModFit software. Cells in G1 and in G2 phase of cell cycle are reported in red, cells in S phase are indicated with white and blue bars. Flow cytometry plots shown are representative of three independent experiments. (B) Graphic representation of relative percentage of cells in G1, S, or G2 phase relative to the experiment shown in A. Percentages of cells in each compartment are means of three independent experiments. (C) miR‐Vec#1, Vec‐miR‐205‐#2 and #20 clones were synchronized in the G1 phase of the cell cycle by thymidine double block, and then cultured in BrdU conditioned medium, harvested at different time points and stained using an anti‐BrdU antibody. The percentage of BrdU positive cells for each time point was analyzed by flow cytometry analysis. Values are the mean ± S.D. of three independent experiments. (D) Total extracts from miR‐Vec#1, Vec‐miR‐205#2 and #20 clones were analyzed by western blot for E2F1 detection (upper panel). Densitometric analysis of E2F1 bands is reported in the lower panel. (E–F) SA‐β‐gal‐staining was performed on miR‐Vec#1, Vec‐miR‐205‐#2 and #20 clones and light microscope cell images were acquired. The percentage of SA‐β‐gal positive cells is reported (E). Values are the mean ± S.D. of three independent experiments. A representative image of each SA‐β‐gal stained clone is reported. Arrows highlight senescent‐like cellular morphology and SA‐β‐gal‐staining in 205#2 and 205#20 clones (F) (For interpretation of the references to color in this figure legend, the reader is referred to the web version of this article.).
