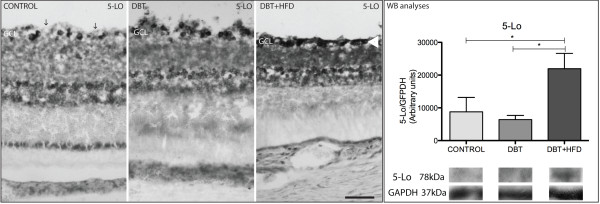
Figure 9.

Immunohistochemical analyses of 5-LO. A similar immunohistochemical pattern was observed in the three groups of animals. The control group shows stained cells separated by free space (arrows) in the GCL while staining in the GCL of the HFD group is much more dense (arrow head). Bar 50 μm. The difference was confirmed by WB analyses. (*p < 0.05).
