
Figure 1.
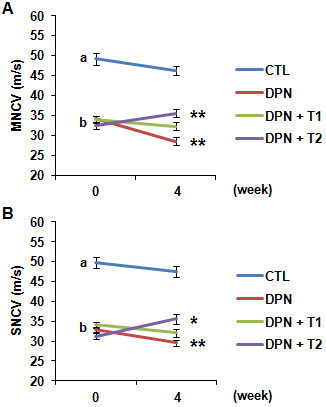
Diabetic peripheral neuropathy (DPN)-induced change in motor nerve conduction velocity (MNCV) and sensory nerve conduction velocity (SNCV). (A) Graph shows the rate of MNCV (m/s) in different groups at day zero and week 4 post-treatment of rhTNFR:Fc. DPN group showed significantly lower MNCV compared with the control group. High-dose rhTNFR:Fc group (DPN + T2) showed a significant recovery in MNCV compared with the DPN group. (B) Graph shows the rate of SNCV (m/s) in different groups at day zero and at week 4 post-treatment of rhTNFR:Fc. DPN group showed significantly lower SNCV compared with the control group. High-dose rhTNFR:Fc group (DPN + T2) showed a significant recovery in SNCV compared with the DPN group. All measurements were done in triplicate and data represent mean ± SEM (n = 12 per group). Statistical significance is denoted as: * P <0.05; ** P <0.01 (4 weeks versus 0 week); a (CTL) versus b (DNP), P <0.001.