Figure 1.

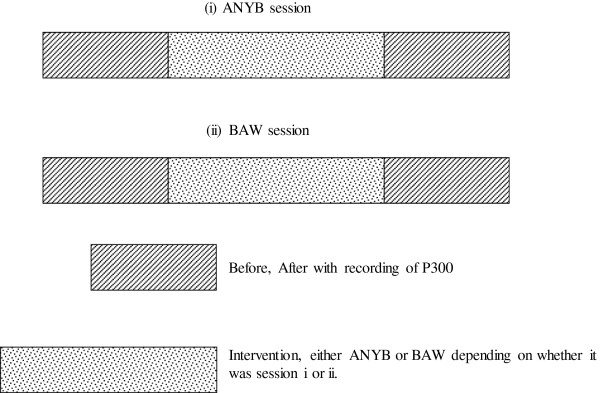
Schematic representation of the design of the two sessions. The P300 was recorded before and after the intervention. Periods of recording are shown as hatched and periods of intervention are shown as stippled.

Schematic representation of the design of the two sessions. The P300 was recorded before and after the intervention. Periods of recording are shown as hatched and periods of intervention are shown as stippled.