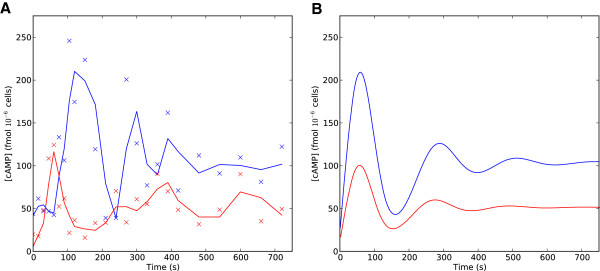
Figure 6.

Variation in cAMP signaling between strain backgrounds. A) Experimental time series of cAMP concentration following glucose stimulus for S288c (red) and Σ1278b (blue). x’s indicate measured cAMP values, the solid lines indicate smoothed values fit by convolving the data with a Blackman window kernel filter. B) Numerical simulations under the non-dimensional model to fit Σ1278b (blue) and S288c (red).
