
Figure 7.
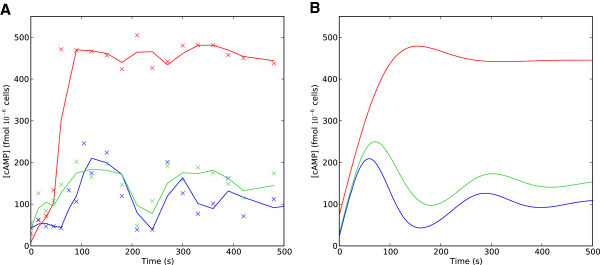
The signaling behavior of PDE mutants in the Σ 1278b strain background. A) Experimental time series of cAMP concentration following glucose stimulus for Σ1278b wild-type (blue), pde1Δ (red) and pde2Δ (green) strains. x’s indicate measured cAMP values, the solid lines indicate smoothed values, as in Figure 7. B) Numerical simulations under the non-dimensional model to fit to the observed data.