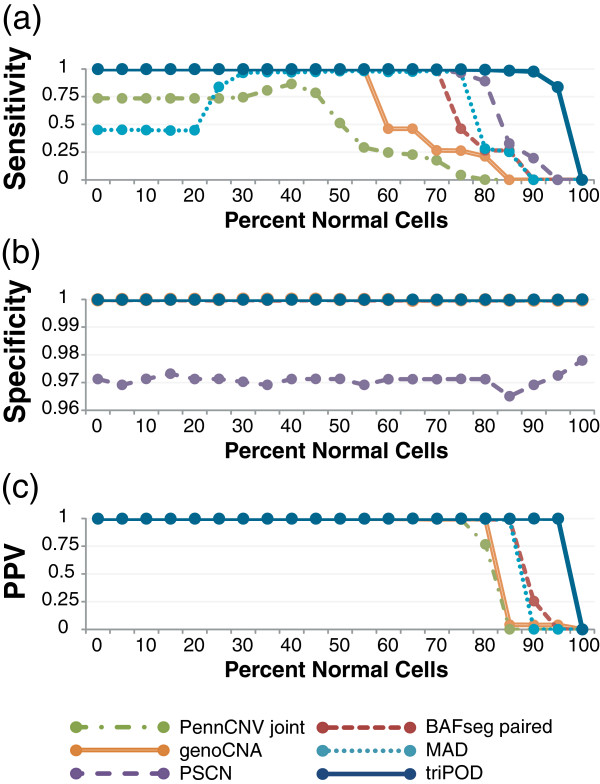
Figure 4.
Mean benchmarking performance statistics. triPOD’s POD implementation was benchmarked against five software programs (paired BAFsegmentation, genoCNA, MAD, PennCNV joint, and PSCN) on a dataset containing simulated mosaic abnormalities. (a) The mean sensitivity, (b) specificity, and (c) positive predictive value (PPV) are plotted for detection of 10 simulated abnormalities across 21 mosaic states.

