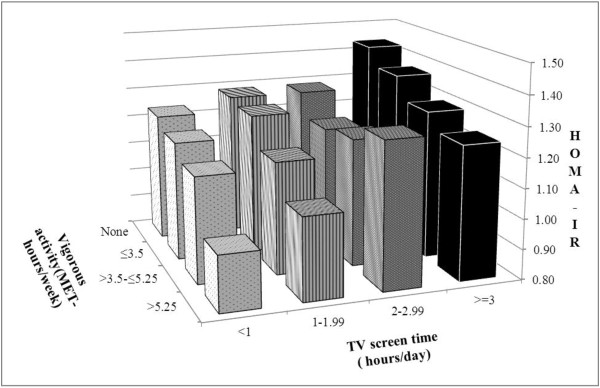
Figure 2.

Adjusted mean of the HOMA -IR by categories of TV screen time and vigorous activity. Estimates were adjusted for age, sex, ethnicity, education, reading time, computer time, employment status, cigarette smoking, alcohol use, and parental history of diabetes and hypertension. As compared with the category with the least TV screen time (<1 hour/day) and the largest amount of vigorous activity (>5.25 MET-hours/week) all categories had significantly higher HOMA-IR values (P<0.05) except the category of having TV screen time <1 hour/day and vigorous activity ≤3.5 MET-hours/week, the category of having TV screen time <1 hour/day and vigorous activity >3.5-≤5.25 MET-hours/week, and the category of having TV screen time 1–1.99 hours/day and vigorous activity>5.25 MET-hours/week.
