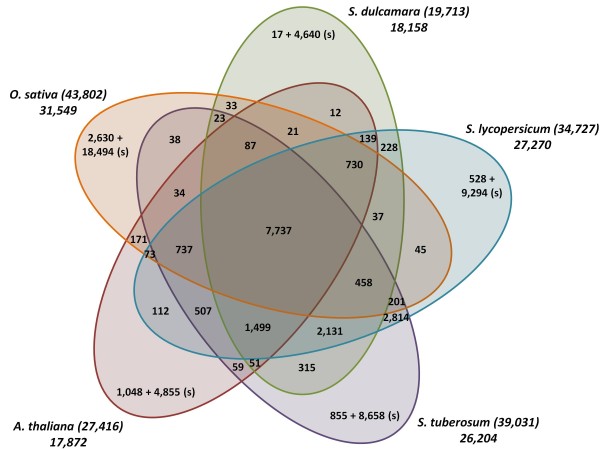
Figure 4.
Venn diagram describing the distribution of orthologous gene groups and singletons (s) identified by clustering 164,689 protein sequences from five different plant species using OrthoMCL. For each species the total number of proteins sequences that were used as input (between brackets) and the total number of ortholog groups plus singletons are indicated.

