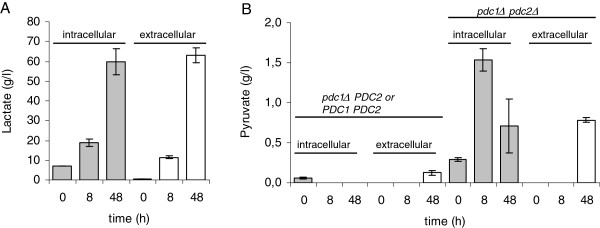
Figure 8.

Intracellular and extracellular lactate and pyruvate. (A) Concentrations of intra- (grey bars) and extracellular (white bars) lactate in strains expressing BmLDH in cultures containing non-limiting concentration of CaCO3. Data are means ± SEM (n=7). (B) Concentrations of intra- (grey bars) and extracellular (white bars) pyruvate in strains containing an intact PDC2, and in pdc1Δ pdc2Δ strains, all expressing BmLDH. Data are means ± SEM (n=3-4). Pyruvate concentrations below 0.03 g/l were not detectable.
