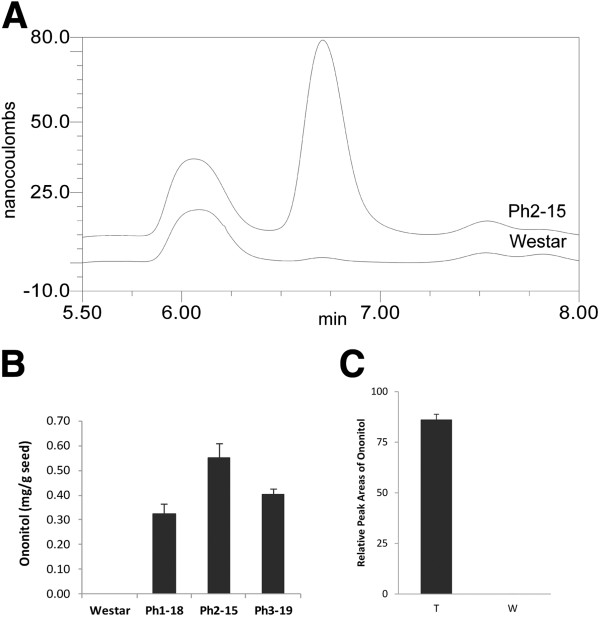
Figure 5.
HPLC evidence of ononitol production by the IMT transgene in transgenic lines. (A) Partial trace of mature seed sugar analysis from a representative transgenic line. The peak at 6.75 minutes corresponds to ononitol; (B) quantitative levels of ononitol in mature seeds of different phaseolin-IMT transgenic lines (Ph1-18, Ph2-15 and Ph3-19). (C) IMT enzyme assay of IMT transgenic lines (T) vs. wild-type control (W). Relative peak areas represent the average ±SE (standard error) of three biological replicates.

