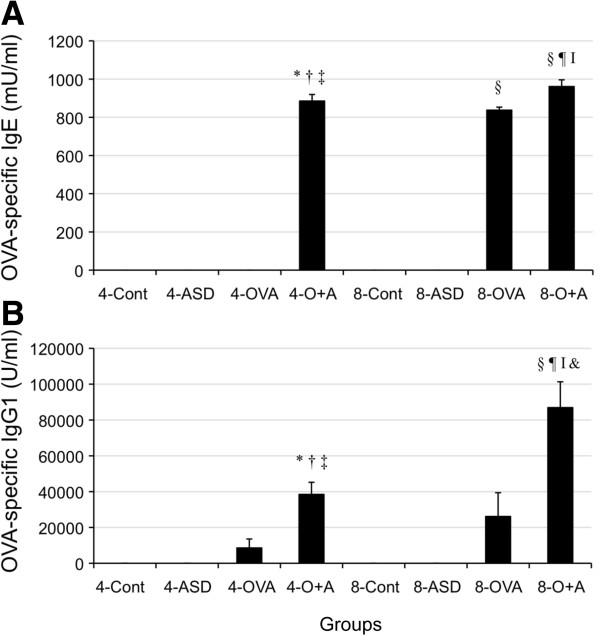
Figure 8.
Effect of ASD on OVA-specific IgE and IgG1 production in serum. (A) shows OVA-specific IgE and (B) shows OVA-specific IgG1. According to the manufacturer’s protocol, 1 U of the anti-OVA IgE is defined as 1.3 ng of the antibody, and 1 U of the anti-OVA IgG1 as 160 ng of the antibody. Results are expressed as mean ± SE. *p < 0.001 vs 4-Control, †p < 0.05 vs 4-Control, ‡p < 0.001 vs 4-ASD, §p < 0.05 vs 4-ASD, ¶p < 0.001 vs 4-OVA, **p < 0.001 vs 8- Control, ††p < 0.001 vs 8- ASD, ‡‡p < 0.001 vs 8-OVA, ¶¶p < 0. vs 4-O+A, &p < 0.05 vs 4-O+A.

