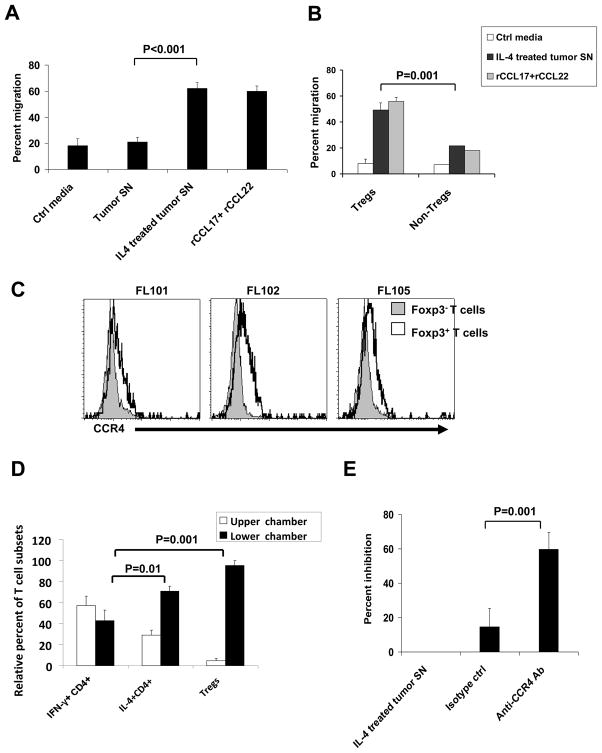
Figure 10. Preferential migration of Tregs and IL-4-producing CD4+ T cells.
(A, B, and E) Tumor cells isolated from FL biopsy samples were incubated in the presence or absence of IL-4 (20 ng/ml) for 48 h, and culture supernatants (SN) were harvested for use in chemotaxis assays. (A and B) Tregs and non-Tregs were isolated to >90% purity from PBMC of normal donors by MACS and used in the chemotaxis assay in the presence or absence of control (Ctrl) media, tumor supernatants, and recombinant CCL17 and CCL22 (200 ng/ml each) as described in the Materials and Methods. Representative data on the percentage of migration of Tregs and/or non-Tregs from four independent experiments are shown. (C) Expression of CCR4 was determined by flow cytometric analysis on CD4+Foxp3− (gray closed histograms) and CD4+Foxp3+ (black open histograms) T cells from three FL biopsy samples. Representative data from three of eight FL samples tested are shown. (D) Intratumoral T cells were isolated to >90% purity from FL102 tumor biopsy sample by MACS using Pan T Cell Isolation Kit and used in a chemotaxis assay in triplicate in the presence of control media (not shown) or recombinant CCL17 and CCL22 (200 ng/ml each). After 2 hours, cells were harvested separately from upper and lower chambers and intracellular cytokine assay and Foxp3 staining were performed as described in Materials and Methods. The relative percentage of CD4+IFN-γ+IL-4−, CD4+IFN-γ−IL-4+, and Treg (CD4+CD25+CD127loFoxp3+) T-cell subsets in the upper and lower chambers was determined using the following formula: (Percent T-cell subset in upper or lower chamber × 100)/(Total percent of T-cell subset in upper and lower chambers). (E) Chemotaxis assay was performed with isolated Tregs as in panel A. Percentage of inhibition of migration of Tregs by isotype control antibody and CCR4 blocking antibody was determined and shown as compared with IL-4–treated tumor SN. Data shown are representative of three independent experiments. All P values were calculated using paired Student’s t test.

