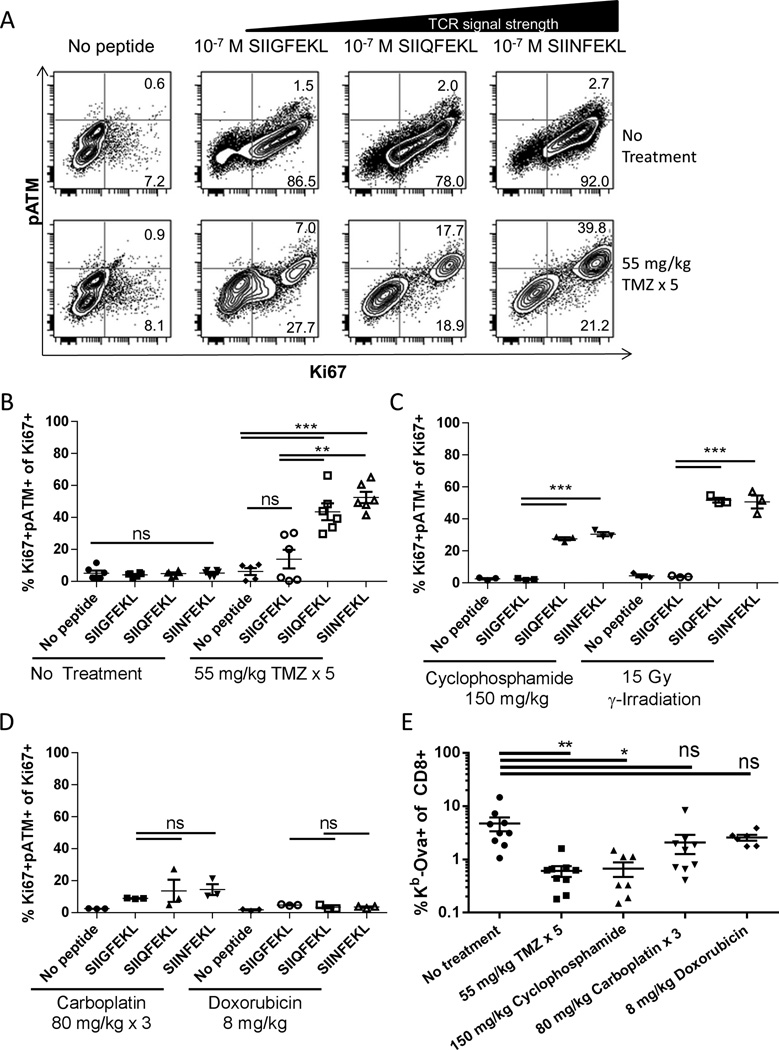
Figure 4. Strong TCR signals induce DNA damage response following alkylating chemotherapy.
(A) OT-I mice were treated with temozolomide for five days and two days later splenocytes were stimulated in vitro with peptide for 48 hours. Cells were stained for CD8, phosphorylated ATM and Ki67 and analyzed by flow cytometry. Representative plots are gated on CD8+ cells. (B) Aggregate data of flow cytometry as performed in (A). Percentage of proliferating (Ki67+) cells that were positive for phosphorylated ATM is plotted. Each experiment was performed with three technical replicates derived from the splenocytes of one mouse treated as indicated. Error bars indicate SEM. ns, not significant (p>0.05); **, p<0.01; ***, p<0.001. Data shown are pooled from two independent experiments with similar outcome. (C) and (D) Aggregate data of flow cytometry performed as in (A) for OT-I mice given the indicated treatments. Error bars indicate SEM. ns, not significant (p>0.05); **, p<0.01; ***, p<0.001. (E) C57BL/6 mice (n=6–9 per group) were given the indicated treatments then vaccinated daily for 4 days with ovalbumin and poly ICLC. 7 days after the first vaccine antigen specific cells in blood were assessed by flow cytometry. Error bars indicate SEM. ns, not significant (p>0.05); *, p<0.05; **, p<0.01. Data are pooled from three independent experiments with similar results.

