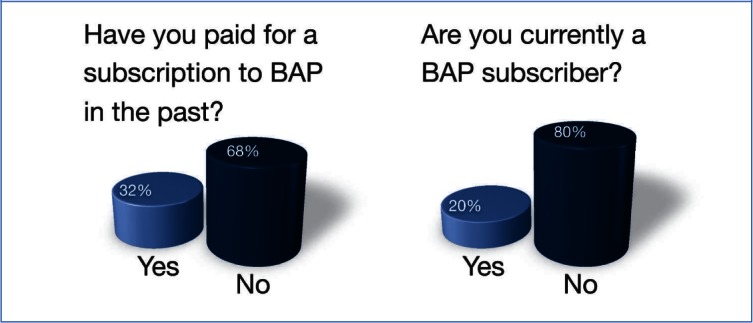
Figure 1.

Participant responses to questions regarding subscriptions to BAP. The figure on the left represents the proportion of participants who have ever subscribed to BAP, while the figure on the right depict the proportion of participants with active subscriptions.
