
Figure 3.
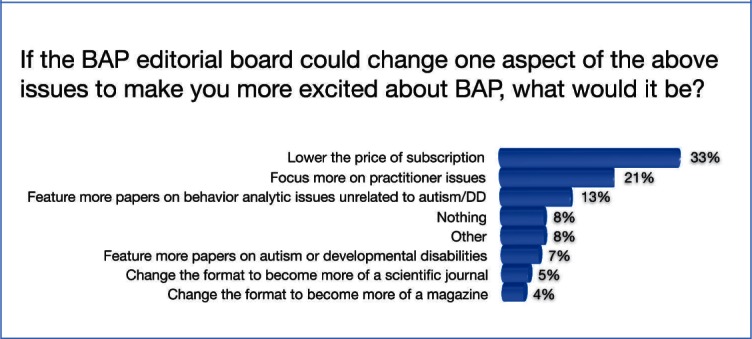
Horizontal bar plot depicting the percentage of participants endorsing items as the number one change that would excite subscribers.
Official websites use .gov
A
.gov website belongs to an official
government organization in the United States.
Secure .gov websites use HTTPS
A lock (
) or https:// means you've safely
connected to the .gov website. Share sensitive
information only on official, secure websites.
Horizontal bar plot depicting the percentage of participants endorsing items as the number one change that would excite subscribers.