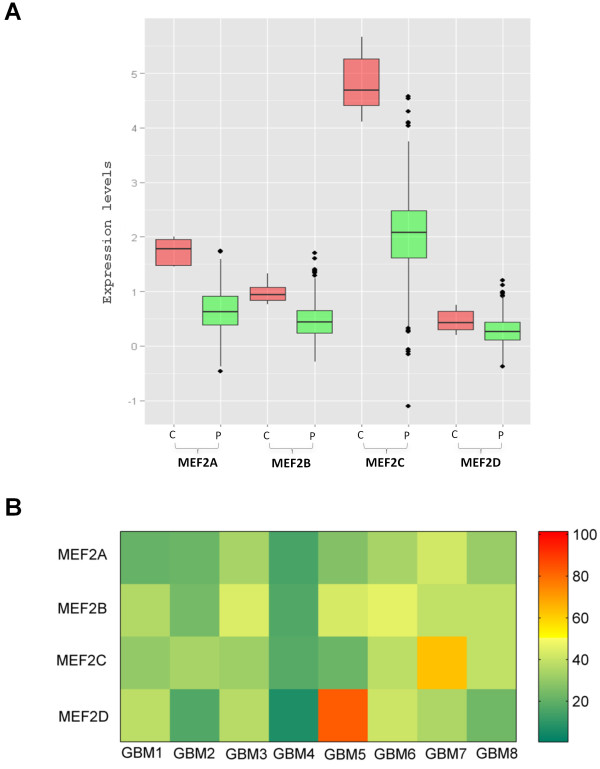
Figure 5.
C14 transcription factor MEF2 is downregulated in GBM. A) Y-axis shows expression levels of different MEF2 isoforms. “C” and “P” represent controls and patient data, respectively. The median expressions of the different isoforms are distinctly lower in GBM (green) than the control samples (red). The normalized expression values were fetched from the TCGA server. B) Real-time PCR validation of MEF2 expression. Y-axis shows different isoforms of MEF2 and X-axis shows 8 GBM samples. Fold change <= 0.6 is taken as down-regulation (green) and >=2 is taken as upregulation (red), whereas, the intermediate values are considered to have non-differential expression (yellow) between the samples (relative to data from six controls). Significant downregulation was found for MEF2A (p = 0.009) and MEF2C (p = 0.04) by Mann-Whitney U test on ΔCt values.

