
Figure 5.
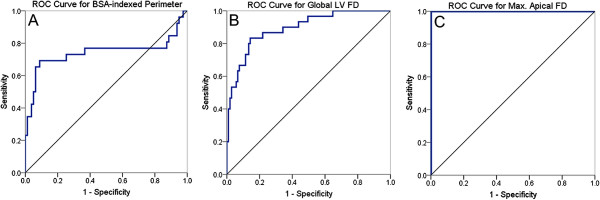
ROC curves for perimetry and the fractal method. ROC curves (in blue) describing the performance of BSA-indexed perimetry (A), global LV FD (B) and maximal apical FD (C) for LVNC diagnoses using as a reference, patient classification according to our study criteria for inclusion of LVNC cases. Diagonal reference lines (in black) are also shown. In white and black populations: BSA-indexed perimetry ≥ 3252 mm/m2 predicts LVNC with specificity 91% and sensitivity 70% (AUC ROC curve 0.741, CI 0.60 – 0.89); global LV FD ≥ 1.26 predicts LVNC with specificity 86% and sensitivity 83% (AUC ROC curve 0.893, CI 0.83 – 0.96); maximal apical FD ≥ 1.30 predicts LVNC with specificity and sensitivity 100% (AUC ROC curve 1.0). ROC = receiver operating characteristics; AUC = area under the curve; BSA = body-surface area; max. = maximum; other abbreviations as in Figures 1 and 4.