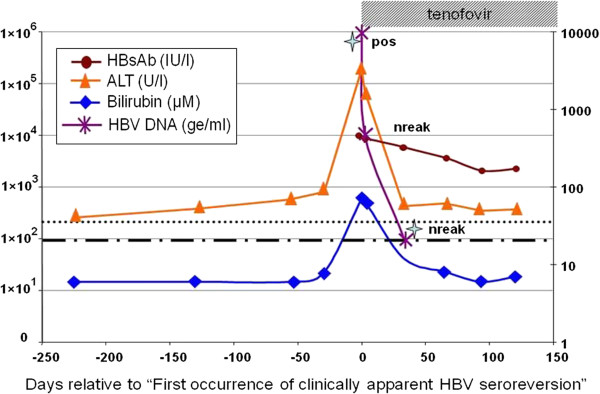
Figure 1.

HBV serology and clinical pathology. Alanine transaminase (ALT) concentrations (U/l) are indicated by triangles (orange triangle) and bilirubin values by squares (blue square). Limit of “normal blood values” are shown by dashes (∙∙∙∙) ALT >35 U/L;(----) Billirubin >(21 μM). HBsAb values are indicated by circles (red circle). Detection of HBsAg is indicated by “pos” (HBs-Antigen detected) or “nreak” (HBsAg negative by COBAS-HBsAg II). Quantitative detection of HBV DNA is indicated by small asterisks (violet asterisks) and sample time points used for HBV genotyping by stars (skyblue stars). Duration of tenofovir therapy: dashed box.
