
Figure 3.
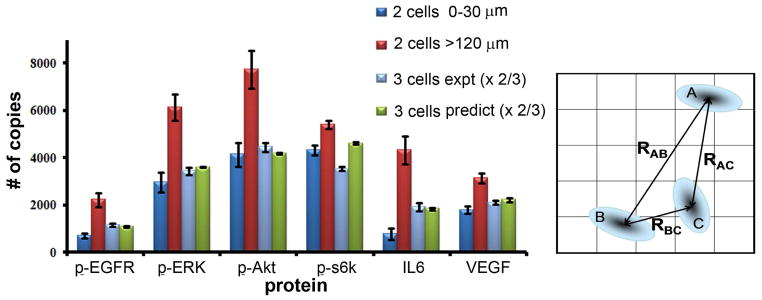
Predictions of average protein levels for 3-cell, 6 hour incubation experiments, compared with the average protein levels recorded from 155 separate 3 cell experiments. Also shown are the average values for the 2 cell experiments for both the smallest and largest of the binned distance ranges. The error bars represent standard error of mean copy number. At right is a drawing of the model used to predict the protein levels of the 3-cell experiments, from the fitted, protein-dependent interaction functions.