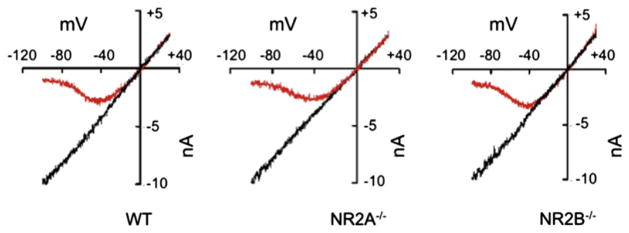
Fig. 8.

Voltage-dependent whole cell NMDA-induced current block by Mg2+. Representative current–voltage (I–V) curves recorded in the absence of Mg2+ (black lines) and in the presence of 100 μM Mg2+ (red lines) in WT, NR2A−/−, and NR2B−/− mouse cortical neurons. The curves were normalized to the current at −100 mV in Mg2+-free solution. (For interpretation of the references to color in this figure legend, the reader is referred to the web version of this article.)
