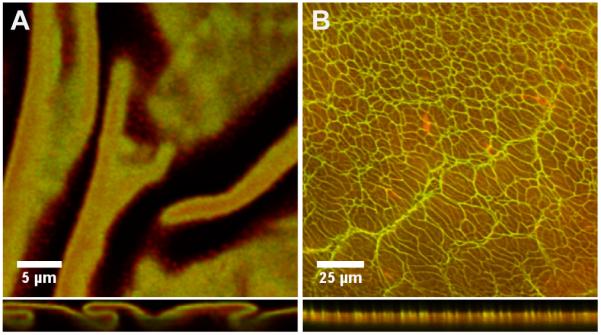
Figure 4.

Confocal micrographs showing the distribution of RBITC-labeled K3 PA and FITC-labeled KLAK PA within the (a) 20% KLAK PA membrane and (b) 50% KLAK PA membrane. Membrane cross-sections are shown in the bottom panels, with the top of the panel corresponding to the side of the membrane that faced biopolymer compartment.
