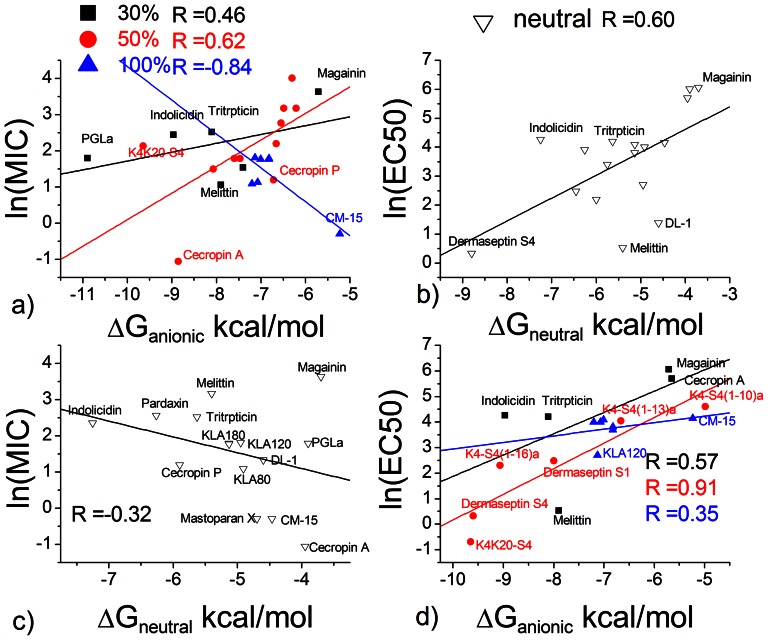
Figure 3. Correlation between experimental binding energy and biological activity.
The lines are the best fit lines. a) ΔGanionic in 25–100% anionic lipid and antibacterial activity against E. Coli. b) ΔGneutral and hemolytic activity. c) ΔGneutral and antibacterial activity. d) ΔGanionic and hemolytic activity. The data points are chosen from Table S1. The unit of MIC and EC50 is µM.

