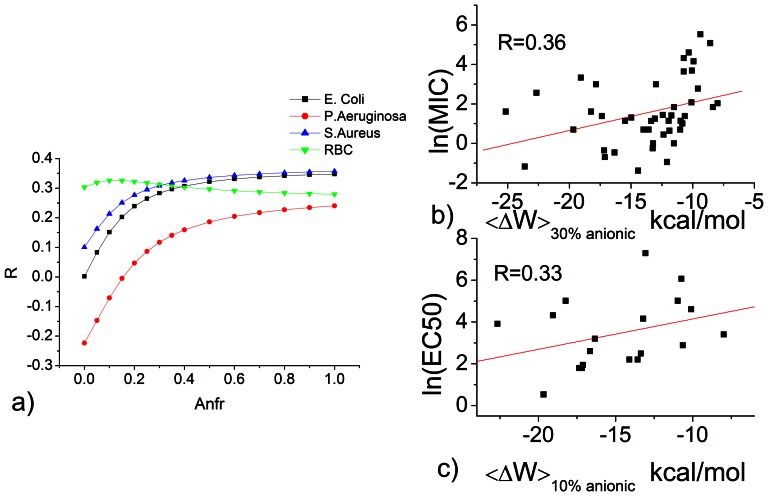
Figure 4. Correlation between transfer energy and biological effective concentrations.
a) The effect of anionic lipid fraction (Anfr) on the correlation coefficient(S) between transfer energy <ΔW> and biological effective concentrations. b) ln(MIC) against E. Coli c). ln(EC50) against red blood cells. The <ΔW> and effective concentration values shown here are listed in Table S2.The unit of MIC and EC50 is µM. Red lines in b) and c) are the best fit lines.

