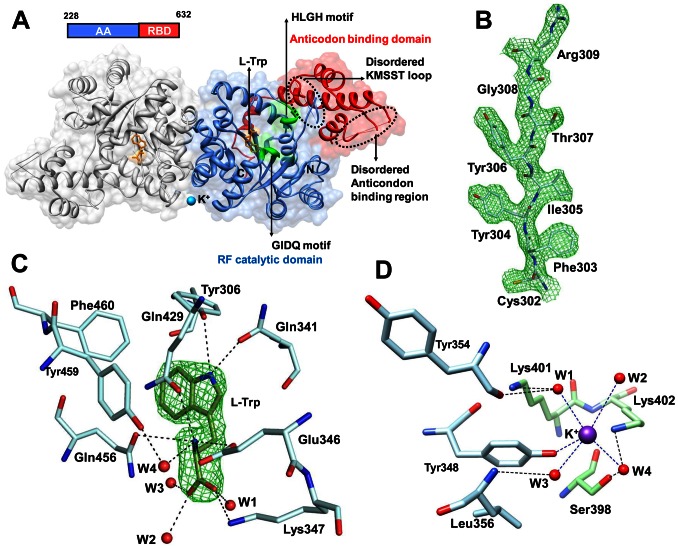
Figure 5. Crystal structure analysis of Pf-WRS AAD in complex with L-Trp.
(A). Bound tryptophan (L-Trp, orange) and K+ ion (blue sphere) are also shown. The aminoacylation domain (blue), anticodon binding domains (red) and the conserved motifs HLGH and GIDQ (green) are highlighted for one monomer. The other monomer is shown in grey. Disordered KMSST loop and anticodon binding region are indicated by dashed circles (B). A portion of the model showing the quality of the 2Fo-Fc electron density map which is contoured at 2.0 σ level (C). Difference Fourier map (Fo-Fc) showing the bound substrate (L-Trp, green). The map is contoured at 5σ level. Interactions between L-Trp, protein residues (blue) and water molecules (red sphere) are indicated by dashed lines (D). Bound potassium ion, coordinating residues from each monomer and water molecules are shown.

