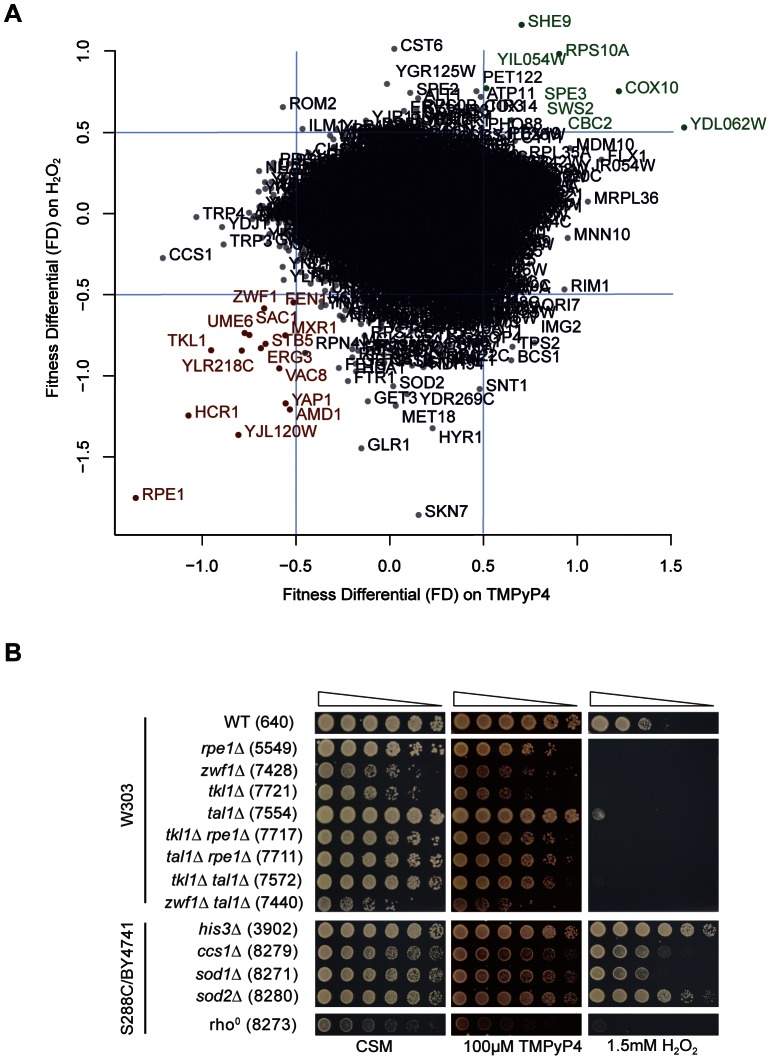
Figure 5. TMPyP4 and hydrogen peroxide treatment result in similar fitness changes.
(A) Correlation plot of fitness differential values from the TMPyP4 screen and H2O2 screen. Genes in red (bottom left-hand corner) were found to increase sensitivity to both TMPyP4 and H2O2 when deleted (FD ≤−0.5). Genes in green (top right-hand corner) were found to decrease sensitivity to both TMPyP4 and H2O2 when deleted (FD ≥0.5). Blue lines denote FD thresholds. (B) Spot test for TMPyP4 and H2O2 sensitivity. Strains were grown to saturation in YEPD before a 5-fold serial dilution in water and spotting onto plates with or without 100 µM TMPyP4. Incubation was carried out at 30°C for 3 days. Strains from three different genetic backgrounds (W303, S288C and BY4741) were tested, as indicated on the left hand side and Table S1 in File S1.

