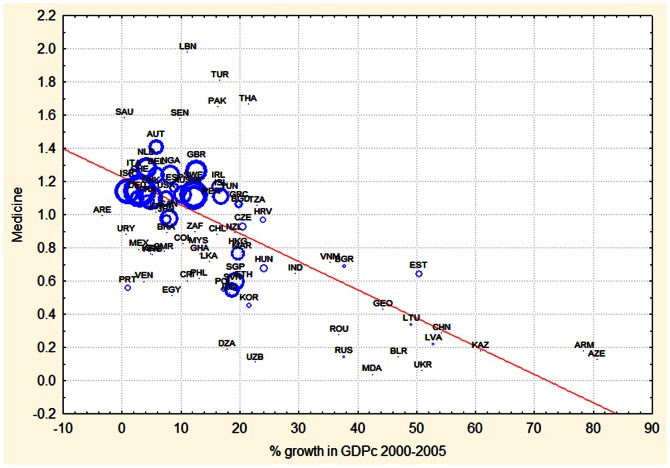
Figure 6. Relation between economic growth achieved during the period 2000–2005 (% change in GDPc) and RCA of medicine during 2000.
The size of the circles is proportional to the total number of publications per capita of that country during 2000. Countries names are given with their ISO abbreviation.

