
Figure 3. The CD31 peptide inhibits TCR-stimulated T cell responses in vitro and drives SHP2 phosphorylation.
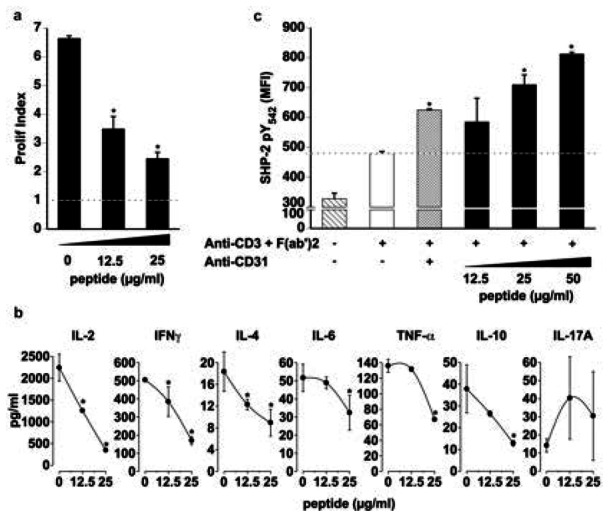
a. Proliferation in response to TCR engagement is inhibited as a function of dose by the CD31 peptide (*p<0.05 vs dose “0”). Proliferation was analyzed by the Modfit® software and expressed as “Prolif Index”. The dotted line represents baseline proliferation (Prolif Index for unstimulated CD4+ cells). b. Cytokine concentrations (pg/ml) in the supernatants of stimulated CD4+ T-cells were significantly reduced by the peptide. (*p<0.05 vs dose “0”). c. Flow cytometric quantification of SHP2 pY542 in stimulated splenocytes. Dotted line (baseline) represents SHP2 phosphorylation induced by TCR engagement alone. Crosslinking of the TCR with surface CD31 molecules induced SHP2 phosphorylation (*p<0.01 vs baseline); Increasing doses of CD31 peptide induced further increments of SHP2 phosphorylation (*p<0.01 vs baseline). Data are expressed as Median Fluorescent Intensity (MFI).