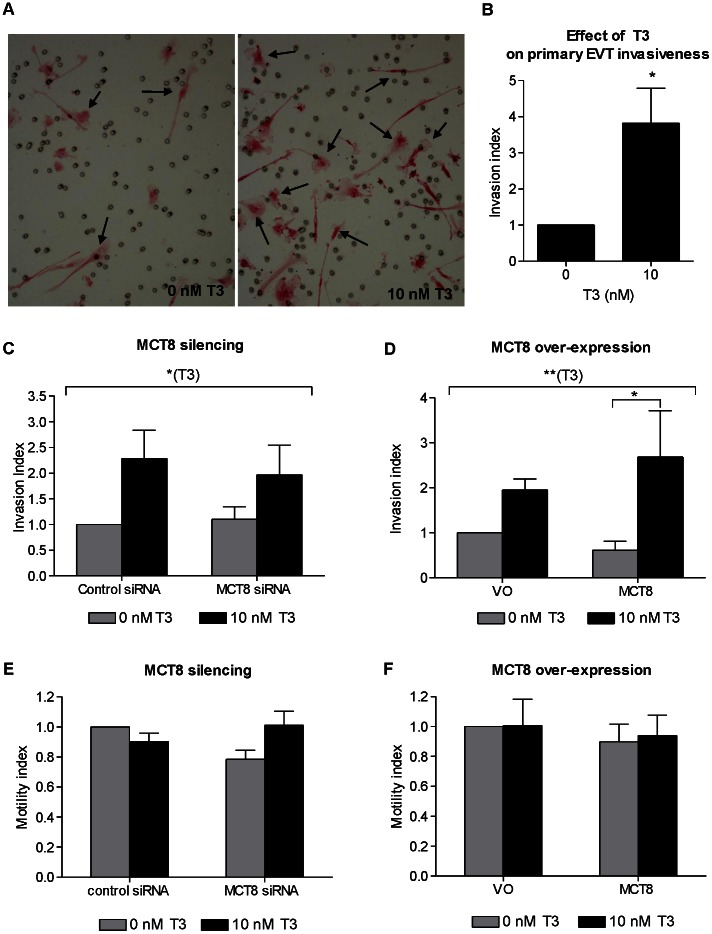
Figure 3. Effect of MCT8 and T3 on EVT invasiveness and motility.
A: Representative pictures of first trimester primary EVT cells that invaded through Matrigel® (arrows) following treatment with 0 or 10 nM T3. The cells were stained with Mayer’s hematoxylin and eosin. B: Index of invasion by first trimester primary EVT following treatment with 0 or 10 nM T3. Bars represent average of six experiments+SEM. Within each experiment, each condition was performed in triplicate and the results normalized to the mean value for the controls. C and D: Invasion of the EVT-like SGHPL-4 cells through Matrigel® following silencing of endogenous MCT8 expression (C) or over-expression of MCT8 (D) and treatment with 0 or 10 nM T3. The number of invading cells was normalized to the average number of invading cells in the control groups that were transfected with control siRNA or VO and treated with 0 nM T3. Bars represent average of seven (silencing) or six (over-expression) experiments +SEM. Within each experiment, each condition was performed in duplicate. E and F: Motility of SGHPL-4 cells. Distance moved following MCT8 silencing with siRNA (E) or over-expression of GFP-tagged MCT8 (F) followed by treatment with 0 or 10 nM T3 for 20 hours. The distance over which cells moved was normalized to the average distance covered by cells in the control groups that were transfected with control siRNA or GFP only (VO) and treated with 0nM T3. Bars represent average of three experiments +SEM. Statistically significant differences are indicated by *P<0.05 and **P<0.01. The longer brackets indicate the overall effect of T3 across all groups by ANOVA and the shorter bracket indicates the significant difference between specific groups assessed by post-hoc testing.

