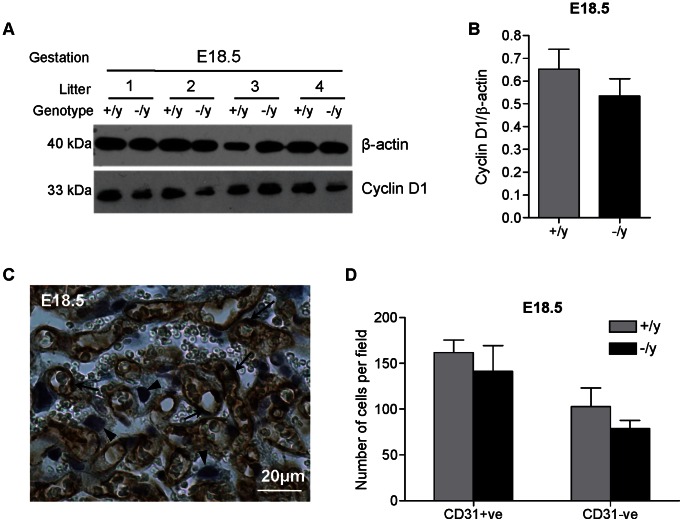
Figure 8. Proliferation and cell number in male wild-type (+/y) and male Mct8 knockout (−/y) placentae.
(A): Changes in the protein expression of Cyclin D1 (proliferation) were assessed by western blotting. The expression of β-actin was assessed to control for sample loading. A representative blot is shown for gestational age E18.5. (B): Relative densitometry analysis based on one wild-type and one Mct8 knockout placenta from each of six litters at E18.5. The bars represent the mean ±SEM. (C): Representative picture demonstrating CD31 immunoreactivity (marker of endothelial cells represented by brown staining) in the mouse placenta at E18.5. The nuclei were counterstained using hematoxylin. Endothelial cells are indicated by arrows and trophoblast cells by arrowheads. (D): Number of trophoblast and endothelial cells (counted in five fields per sample under a 20× objective) in the labyrinthine zone of +/y and −/y placentae. One wild-type and one Mct8 knockout placenta from each of four litters at E18.5 were assessed. The bars represent the mean ±SEM.

