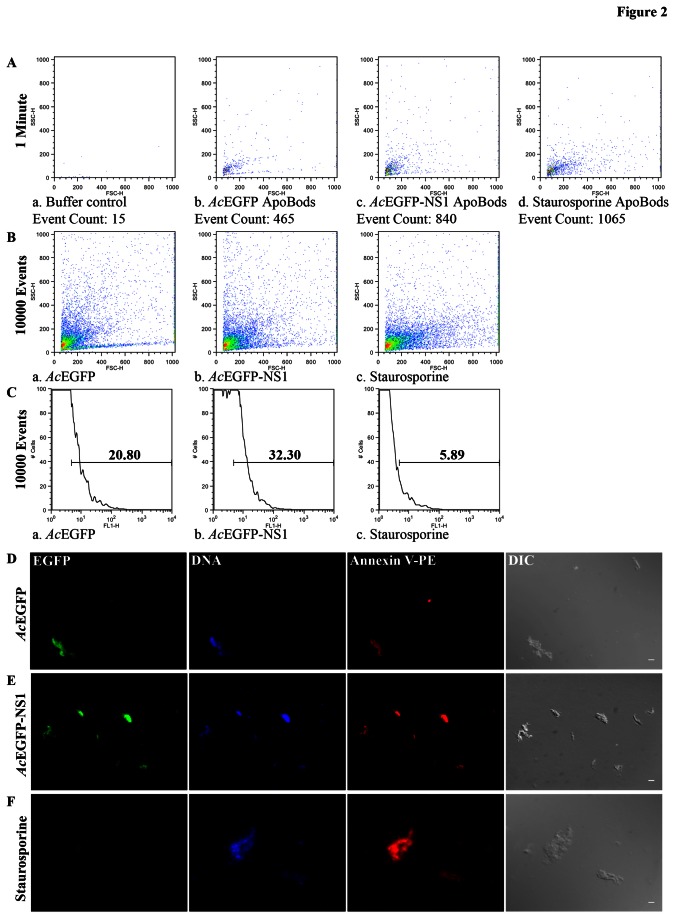
Figure 2. Self-antigens are present in ApoBods created by NS1 expression and those ApoBods can be purified and quantified.
Flow cytometry analysis was conducted on purified ApoBods from AcEGFP and AcEGFP-NS1 transduced cells, and staurosporine positive samples. Representative dot plots and histograms are provided. Experiments were conducted independently three times. (A) Counts were recorded for 1 min to compare the amount of ApoBods produced in each condition, buffer control, ApoBods produced from transductions of AcEGFP, ApoBods from AcEGFP-NS1 transduction, and ApoBods from staurosporine treated cells. (B) Event counts were recorded in order to reach 10,000 events to compare the percentage of green signal from each ApoBods production situation. ApoBods produced from transductions of AcEGFP, ApoBods from AcEGFP-NS1 transduction, and ApoBods from staurosporine treated cells were verified. Buffer control was not added here due to absence of events. (C) Histograms of the green fluorescent signal from the previous event counts for each ApoBods production condition. Gated bar indicated the percentage of green signal. Fluorescent microscopy images of purified ApoBods created from (D) AcEGFP and (E) AcEGFP-NS1 transductions and, (F) Staurosporine treated cells. Purified ApoBods were visualized directly for EGFP (green), stained for DNA with DAPI (blue), labeled for PS with Annexin V-PE (red), and visualized with DIC microscopy to see the morphology. Bars 5 µm.

