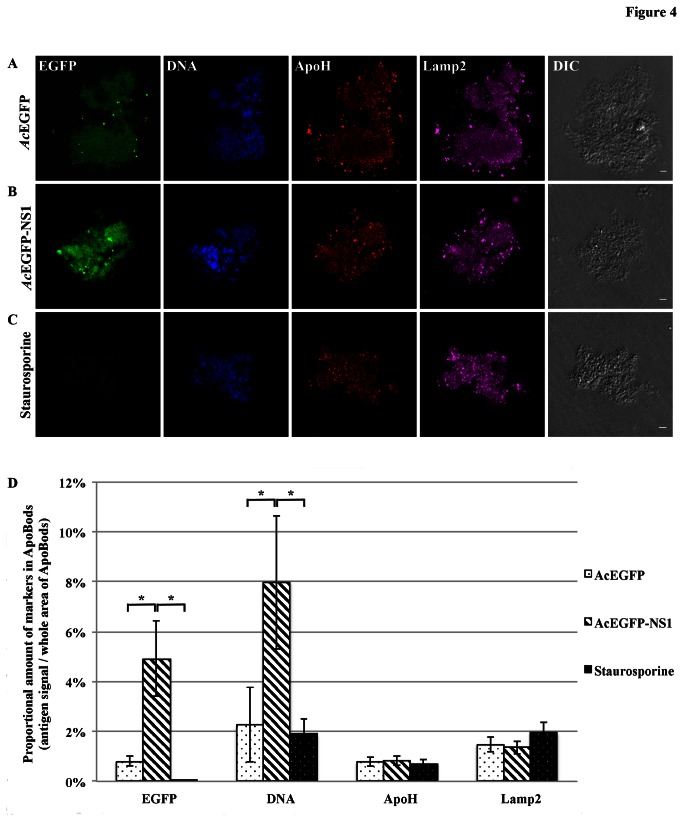
Figure 4. Cytosolic antigens apolipoprotein-H and lysosomal, exist in NS1 induced ApoBods.
Confocal microscopy of purified ApoBods produced from with (A) AcEGFP, and (B) AcEGFP-NS1 transduced cells and (C) Staurosporine treated HepG2 cells. Presence of EGFP, DNA, ApoH (apolipoprotein-H), and Lamp2 (lysosomal) antigens are highlighted as green, blue, red and violet, respectively. DIC is displayed to indicate morphology of the ApoBods. Bars 5 µm. The proportion of amount of antigen markers in ApoBods (volume of antigens / total area of ApoBods) was presented as mean ± SEM (N = 30), (D). *P < 0.05.

