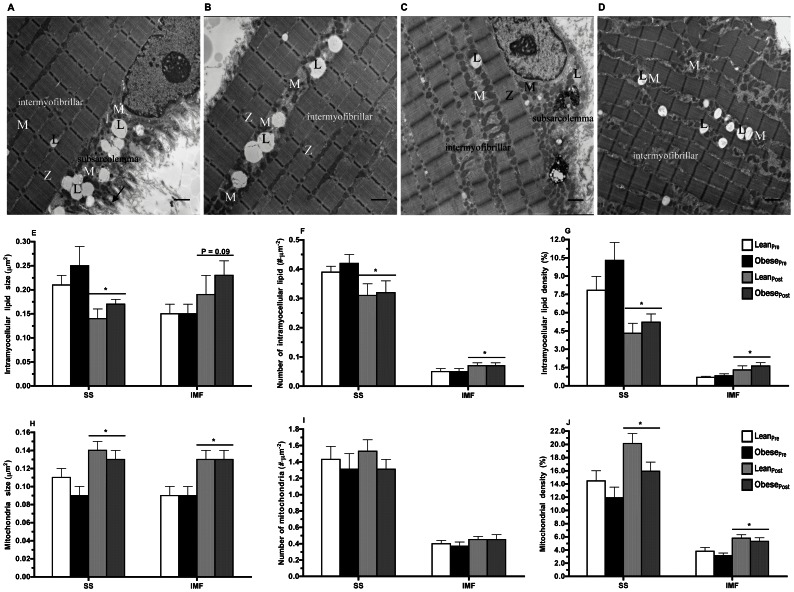
Figure 3. Transmission electron microscopy assessment of intramyocellular lipid and mitochondrial content.
Micrographs of a skeletal muscle cell illustrating subsarcolemmal (A) and intermyofibrillar (B) intramyocellular lipid (IMCL) and mitochondria prior to (A,B) and following 12-wk endurance training (C,D). Subsarcolemmal (SS) IMCL and mitochondria are located between the sarcolemma and the most superficial myofibrils. The intermyofibrillar (IMF) IMCL and mitochondria are located between parallel bundles of myofibrils. The micrographs (X6,500 magnification, scale bar: 1 µm) were obtained from a biopsy of the vastus lateralis muscle from an obese participant. L, intramyocellular lipid droplet; M, mitochondria, Z, Z-line. IMCL size (E), number (F), and density (G) in SS and IMF regions of skeletal muscle of lean (n = 9) and obese (n = 9) men prior to and following 12-wk endurance training. *P≤0.05 pre- vs. post-training (main effect). Mitochondria size (H), number (I), and density (J) in SS and IMF regions of skeletal muscle of lean (n = 9) and obese (n = 9) men prior to and following 12-wk endurance training. *P≤0.01 pre- vs. post-training (main effect).

