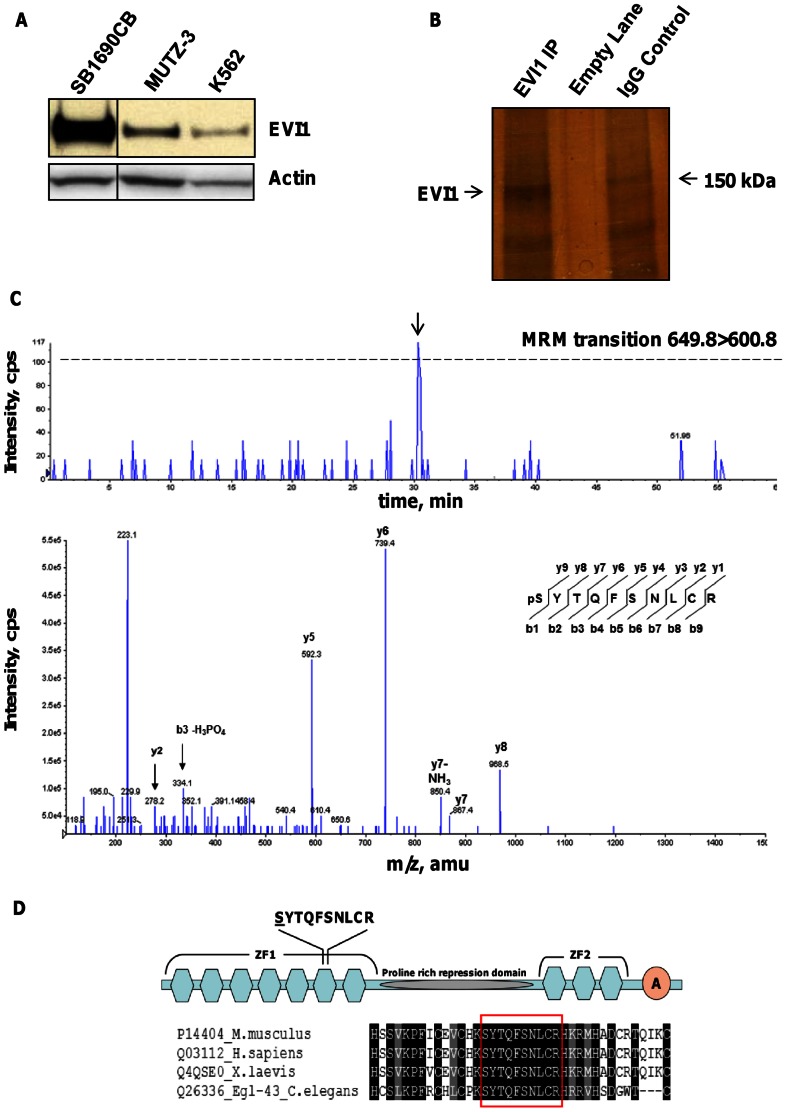
Figure 1. EVI1 is phosphorylated on Serine 196 in SB1690CB cells.
(A) Western blot detection of EVI1 from whole cell lysate of leukemia cell lines SB1690CB, MUTZ-3 and K562. A vertical line has been inserted to indicate a repositioned gel lane. (B) Silver staining of immunoprecipitated EVI1 protein (arrow) from large scale SB1690CB cultures. Negative control lane showing immunoprecipitation with an irrelevant IgG antibody. (C) Extracted ion chromatograph showing signal intensity at time for the MRM transition 649.8>600.8 designed to selectively detect the EVI1 peptide SYTQFSNLCR with a single serine or threonine phosphorylation. The threshold for triggering fragmentation and sequencing of the peptide was 100 counts per second (cps) and is indicated with a dashed line. A peak exceeding this threshold was eluted at 30.49 min and triggered fragmentation of the peptide (arrow). Lower panel: product ion spectrum generated by peptide fragmentation. Detected y- or b-type fragment ions are indicated. Sequence of the EVI1 phosphopeptide with the b-ion and y-ion series and position of the phosphorylated serine residue at the N-terminus of the peptide is shown. (D) Illustration showing the location of phosphorylated peptide within the EVI1 protein, with hexagons for zinc finger (ZF) motifs and acidic region, A-circle, at the carboxy terminal region (modified from [48]). Underlined is the serine residue at site of phosphorylation. Alignment was carried out using the t-coffee algorithm at www.t-coffee.org [49]. Shown is alignment to human EVI1 amino acids H182 to C219 with the phosphorylated peptide boxed in red.

