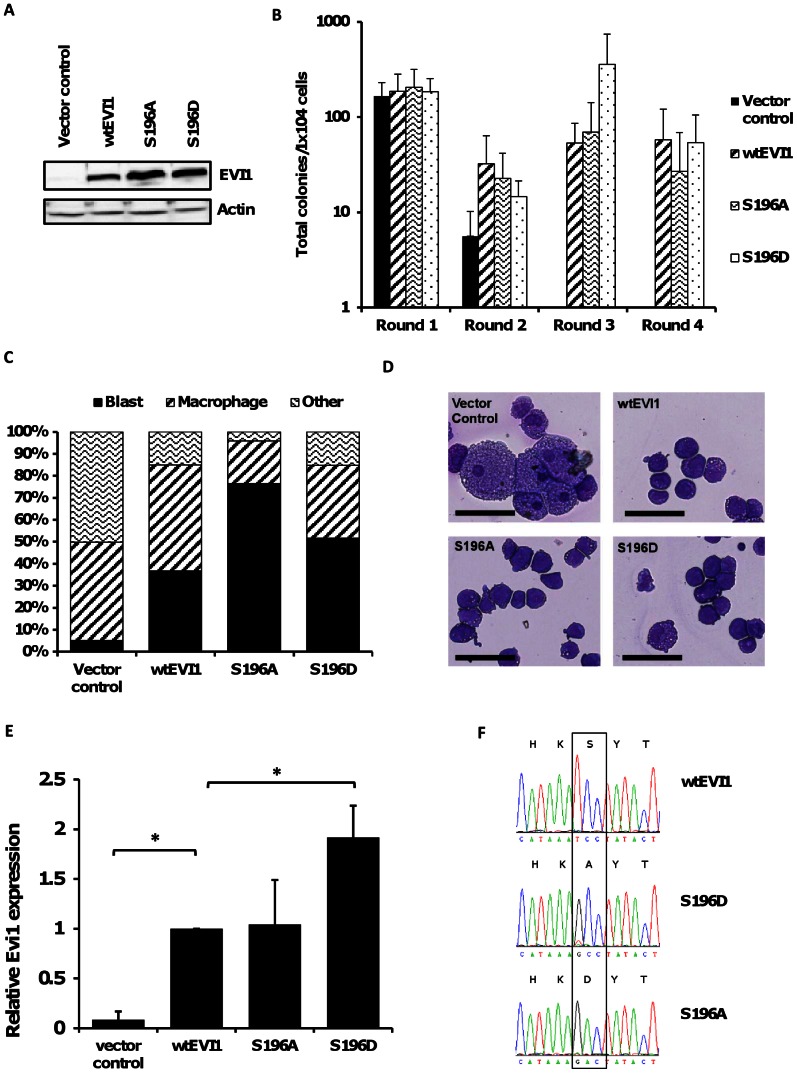
Figure 5. Serial replating of murine hematopoietic progenitor cells transduced with wtEvi1 and Evi1 phosphorylation site mutants.
(A) Western blot analysis of Evi1 expression in PLAT-E cells two days after transfection with retroviral vectors encoding wtEVI1, Evi1-S196A, Evi1-S196D or empty vector control. (B) Total colony numbers (mean±s.d, n = 5) formed in serial replating assays by c-kit positive cells transduced with wtEVI1, S196A, S196D or control retroviral expression vectors. (C) Percentage of cell types (blast, macrophage or other) enumerated by morphological analysis of May-Grünwald Giemsa stained cytospins after the third round of replating. Mean, n = 4. Photomicrographs of May-Grünwald-Giemsa-stained cytospins after the third round of replating of transduced cells expressing WT or mutant EVI1 as shown. Scale bar indicates 50 µM. (D) Photomicrographs of May-Grünwald-Giemsa-stained cytospins after the third round of replating of transduced cells expressing WT or mutant EVI1 as shown. Scale bar indicates 50 µM. (E) Relative Evi1 expression in c-kit+ cells after the first round of plating determined by qRT-PCR analysis. Mean±s.d, n = 4. *P<0.01. (G) Sanger-Sequencing of Evi1 transcripts from c-kit+ cells after the first round of plating. Electropherograms illustrating DNA-sequence around codon encoding S196. Nucleotide and amino acid sequence (single letter amino acid code) are shown.

