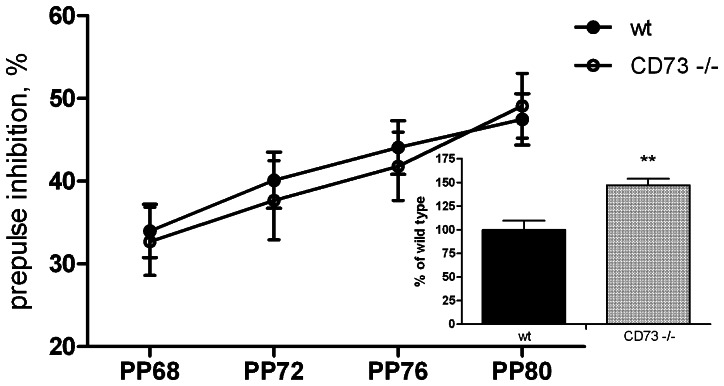
Figure 3. CD73 deficient and wt mice display similar pre-pulse inhibition but startle response is enhanced in CD73 deficient mice compared to wt mice.
Percentage of pre-pulse inhibition averaged across all pre-pulse intensities. Insert bar graphs represent percentage of alteration of startle response without pre-pulse stimulus from the wild type animals’ startle response level (wt mice, n = 38; CD73 deficient mice, n = 29). The results from both sexes are combined, because there was no sex effect or sex X genotype interaction. Mean values are plotted with SEM, **p<0.01 t-test.

