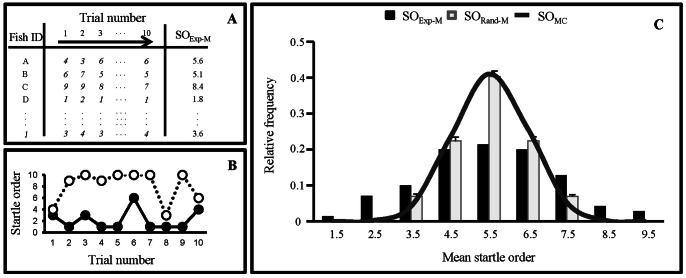
Figure 2. Fish show a non-random startle order.
(A) Example of an experimental block, defined as a series of ten trials (ten successive stimulations of the same school). Numbers in italics indicate SO of a given fish in a given trial (e.g. in trial #1, fish A is the 4th individual to react). (B) Individual fish tended to retain similar startle orders through 10 successive escape responses. Examples of a fast (filled symbols, continuous line) and a slow reacting fish (open symbols, dotted line) within a school. (C) The SOExp-M distribution (black columns, N = 70) showed a statistically wider variance than all of the SORand-M distributions [grey columns represent the mean ± S.E. of the ten simulations of SORand-M (N = 70 for each simulation)] and the SOMC distribution (dark line, N = 20000).

