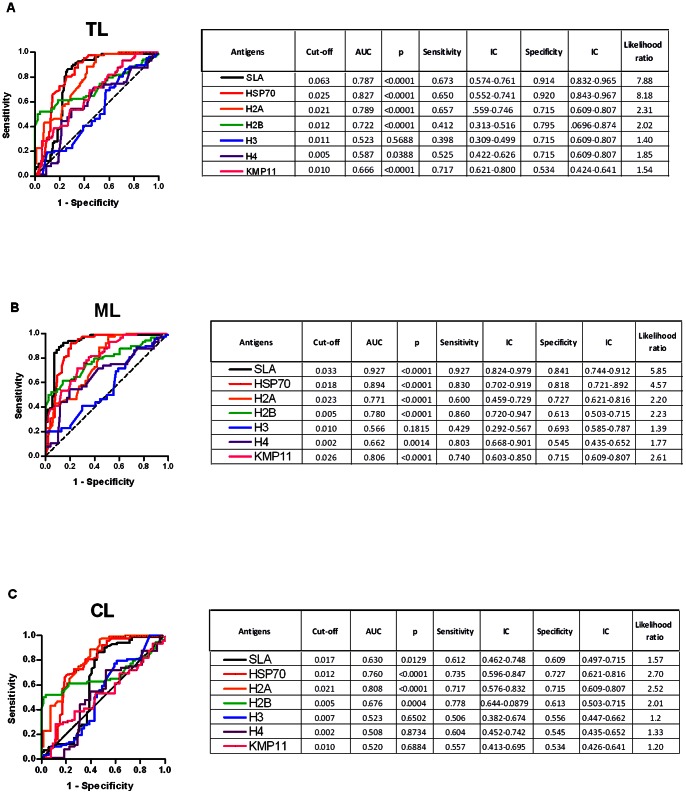
Figure 2. ROC curve of antibody levels predict the positivity thresholds against parasite antigens.
The ROC curves were constructed using data obtained in ELISA performed with antigens and sera from TL (n = 102) (A), ML (n = 53) (B) or CL (n = 49) (C) patients and control subjects from an endemic (n = 39) and from a non-endemic (n = 49) area. The solid lines represent the area under the curve and the dotted line represents the identity line curves. The tables show the detailed information obtained for each ROC curve (cut-off values chosen, area under the curve, the values of p, and the sensitivity and specificity with a confidence interval of 95% and the likelihood ratio).

