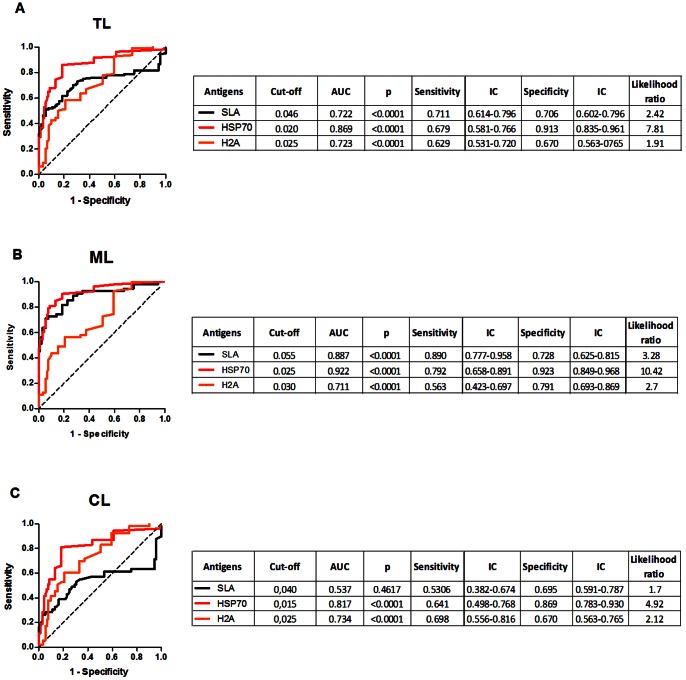
Figure 4. ROC curve of antibody levels predict the positivity thresholds against rHSP70 and rH2A.
ROC curves were constructed using data obtained with sera from TL (n = 102) (A), ML (n = 53) (B) and CL (n = 49) as patients and sera from individuals with Chagas' disease (n = 30), SLE (n = 10), leprosy (n = 30) and tuberculosis (n = 22) as negative control. The solid lines represent the area under the curve and the dotted line represents the identity line curves. The tables show the detailed information obtained from each ROC curve (cut-off values chosen, area under the curve, the p values, and the sensitivity and specificity with a confidence interval of 95% and the likelihood ratio).

