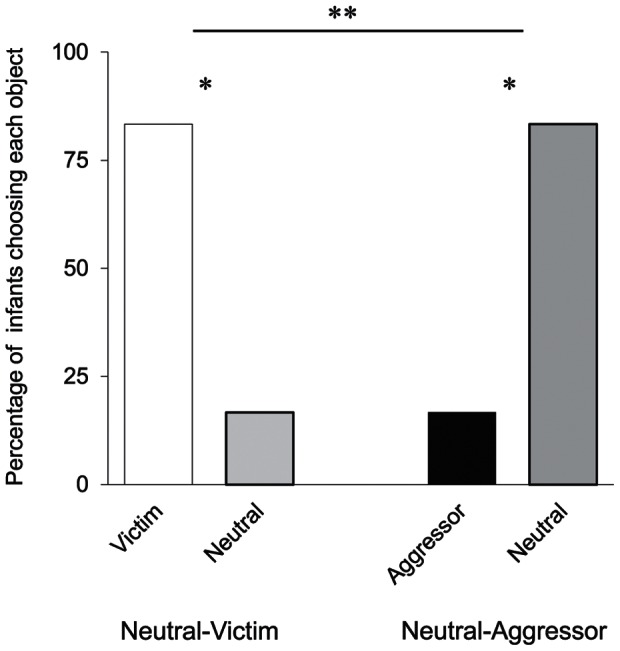
Figure 3. The results of the choice task in Experiment 2.

This figure shows the percentage of infants who chose each object (Experiments 2, n = 12 in each condition). Single asterisks indicate statistical significance, one-tailed, p<.05. Double asterisks indicate statistical significance, two-tailed, p<.05. NS indicates not significant.
